Learning multiple single cell trajectories with OMGP
A fundamental concept in cellular biology is that progenitor cells can differentiate into different kinds of specialized cells performing particular functions. Recently, the ability to study this using single-cell RNA-sequencing has gotten extremely popular. How to learn this from individual snaphsots rather than tracked cells?
In the immune system, naive T-helper cells differentiate into different types of cells depending on the kind of infection. In particular, in the system we studied in Lönnberg, Svensson, James, et al Science Immunology 2017, naive Th cells respond by differentiating into either Th1 cells or Tfh cells.
If we perform measurements on these cells, the problem is that we don't know the labels for the cells. That is, what trjectory are they part of: 1) Naive -> Th1 or 2) Naive -> Tfh?
When we observe only a single trajectory over time, a good way to model a measurement over the trajectory time points is by Gaussian Process (GP) Regression.
where we say the function f∼GP(0,k(tn,tm) is Gaussian process distributed.
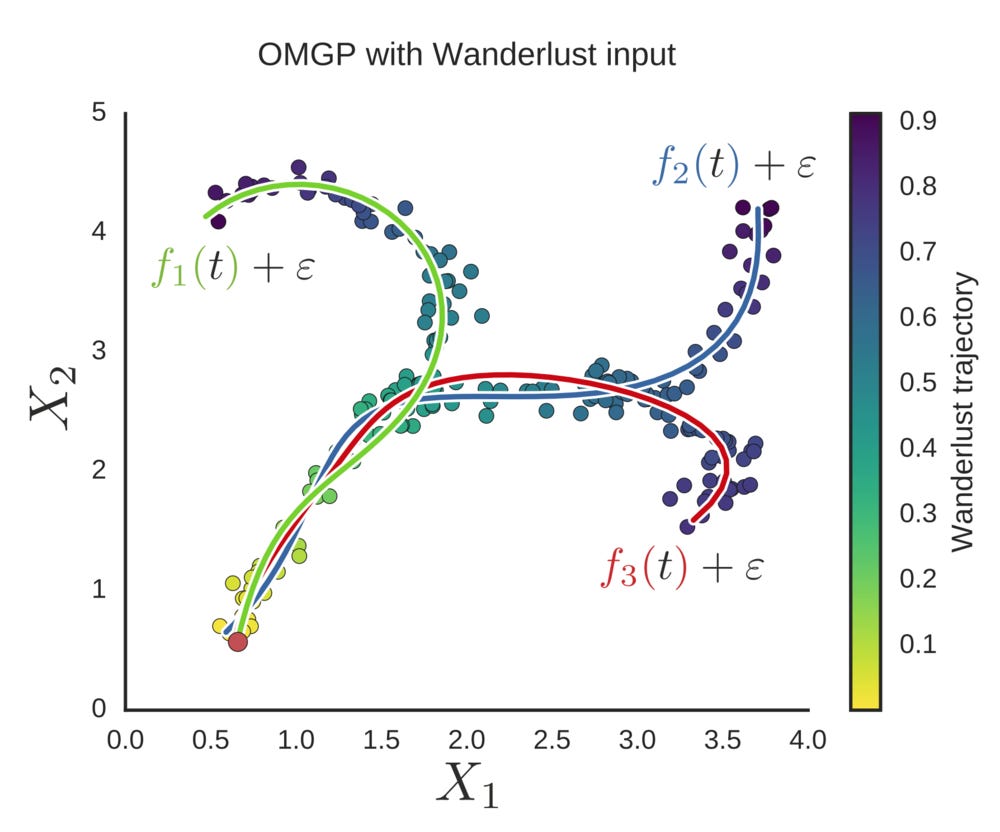
Observing data which seem to come from two separate trends, we can think of each data point as being generated by
Here zn is a binary vector which can only have one element as 1, indicating which function the point Xn is generated from.
In our case, we do not know z for the data points. We need to learn these values from the data. As a probabilistic model, what we are interested in is the assignment of each sample to a given trajectory.
What we can infer from the data is the posterior probability of the z function indicators:
It turns out that you can learn these probabilites, and it was published as the Overlapping Mixture of Gaussian Processes (OMGP) in Lázaro-Gredilla et al 2013 Pattern Recognition.
I want to highlight here that the observations, X, can have any dimensionality. A single measure like the expression of a particular marker gene, or multiple genes at once. In my examples here, I let X be two-dimensional, intuitively corresponding to two marker genes. The model works with any number of trends C, not only the case C=2 in the equation above.
We implemented this model in the package GPClust, using a sophisticated inference method underlying that package which I won't go into here. In our implementation, we extended the model to use a Dirichlet Process (DP) for the indicators z. This allows the number of trajectories C to be determined from the data. (Though there is still a parameter α which will affect this).
To illustrate this, I created some 2D data with four trends, and used diffusion pseudotime to define the t values for the data. Then I initiate the model and animate the process of learning the trend assignments, plotting 10 trends.
We see that during inference, the model learns that four trends are sufficient to explain the data.
At the same time we can visualise the ϕ values of the data points for a couple of the trends.
This illustrates how the tree structure in the data is captured. The structure is not explicitly modeled, which is a limitation of this model. The probability of trends being ambiguous can however be interpreted as a common branch.
We applied this to the single-cell RNA-seq data of the immune cells in our study, to learn about the bifurcation of cell types happening during the malaria immune response.
This way we learned about the relation between the branching of cell types, and the time from infection.
We were also able to use the model to perform hypothesis testing on all genes in the data, and identify new genes corresponding to the bifurcating development. See our paper for further details!
The OMGP model has probably so far been the favourite thing I've worked with during my PhD. I can still very vividly remember reading the original OMGP paper and the GPclust related papers on a train ride through Austria and started working on the application.


