
SCVI - Estimating null expression levels

In this post I motivate why I think it would be useful to have clear thresholds for when a gene is not expressed, test a strategy to obtain such thresholds, and learn it doesn’t work.
In cell biology, we think of discrete populations of cells, that we say do or do not express some (ideally) specific marker.
When we say that immune cells express CD45, that means “more CD45 than we can see in other cells from the same context”. T cells are considered expressing CD3, which means “more CD3 than other immune cells”, and defining CD4+ T helper cells means “T cells that express more CD4 than other T cells”.
Mentally, we are always operating on a relative scale. We work at the very edge of what technologies can detect. To illustrate that something exists, it is in comparison to a negative control where we know it doesn’t exist.
In single cell genomics, a gene being highly expressed in a cell can have two different meaning: the gene is highly expressed in that cell relative to other cells, or the gene is highly expressed relative to other genes in that cell.
This relative relation between gene expression levels in individual cells is explicitly modeled in SCVI. The SCVI model takes observed UMI counts as input, encodes them to representation vectors z, then decodes them to relative abundance levels rho for each gene. A softmax operation at the end of the decoder ensures that the relative abundances sum to 1:
During training, the relative abundances, rho, are combined with the observed library size, l, to quantify whether the predicted relative abundance is compatible with the observed UMI counts of a gene g in a cell:
The predicted rho values can be treated as normalized expression levels. Normalized, since they aim to remove the observed variation due to differences in library size. They also tend to have higher resolution than observed UMI counts, summarizing informative coexpression relationships between all the observed input genes through the encoder and decoder, resulting in continuous rather than discrete values.
These normalized expression values are great for exploring single cell RNA-sequencing data. Many cell types and cell states are defined by having ‘high’ expression of some gene, then additionally ‘high’ or ‘low’ expression of some other gene.
As an example, we can use a recent dataset by Michki et al 2025. In the paper, the authors investigate the effects of e coli infection in juvenile and neonatal mouse lungs. They collected lungs at 48 hours and 96 hours after infecting the mice with e coli, as well as negative control samples that can be used for comparison.
After fitting and saving an SCVI model, we can use the model to generate normalized expression levels rho for any genes we are interested in. If we want to study T cells, we might produce normalized expression levels for the genes Ptprc and Cd3d. Ptprc is the gene encoding CD45, a transmembrane receptor which enables fundamental external-to-internal protein-protein interactions required for almost all immune cells. Its presence is a classical global marker for immune cells. The gene Cd3d encodes the delta chain of the CD3 protein complex, which together with the T cell receptor complex enables antigen recognition by T cells.
To explore the lung cells from the experiment, we can plot the bivariate distribution of Ptprc and Cd3d expression.
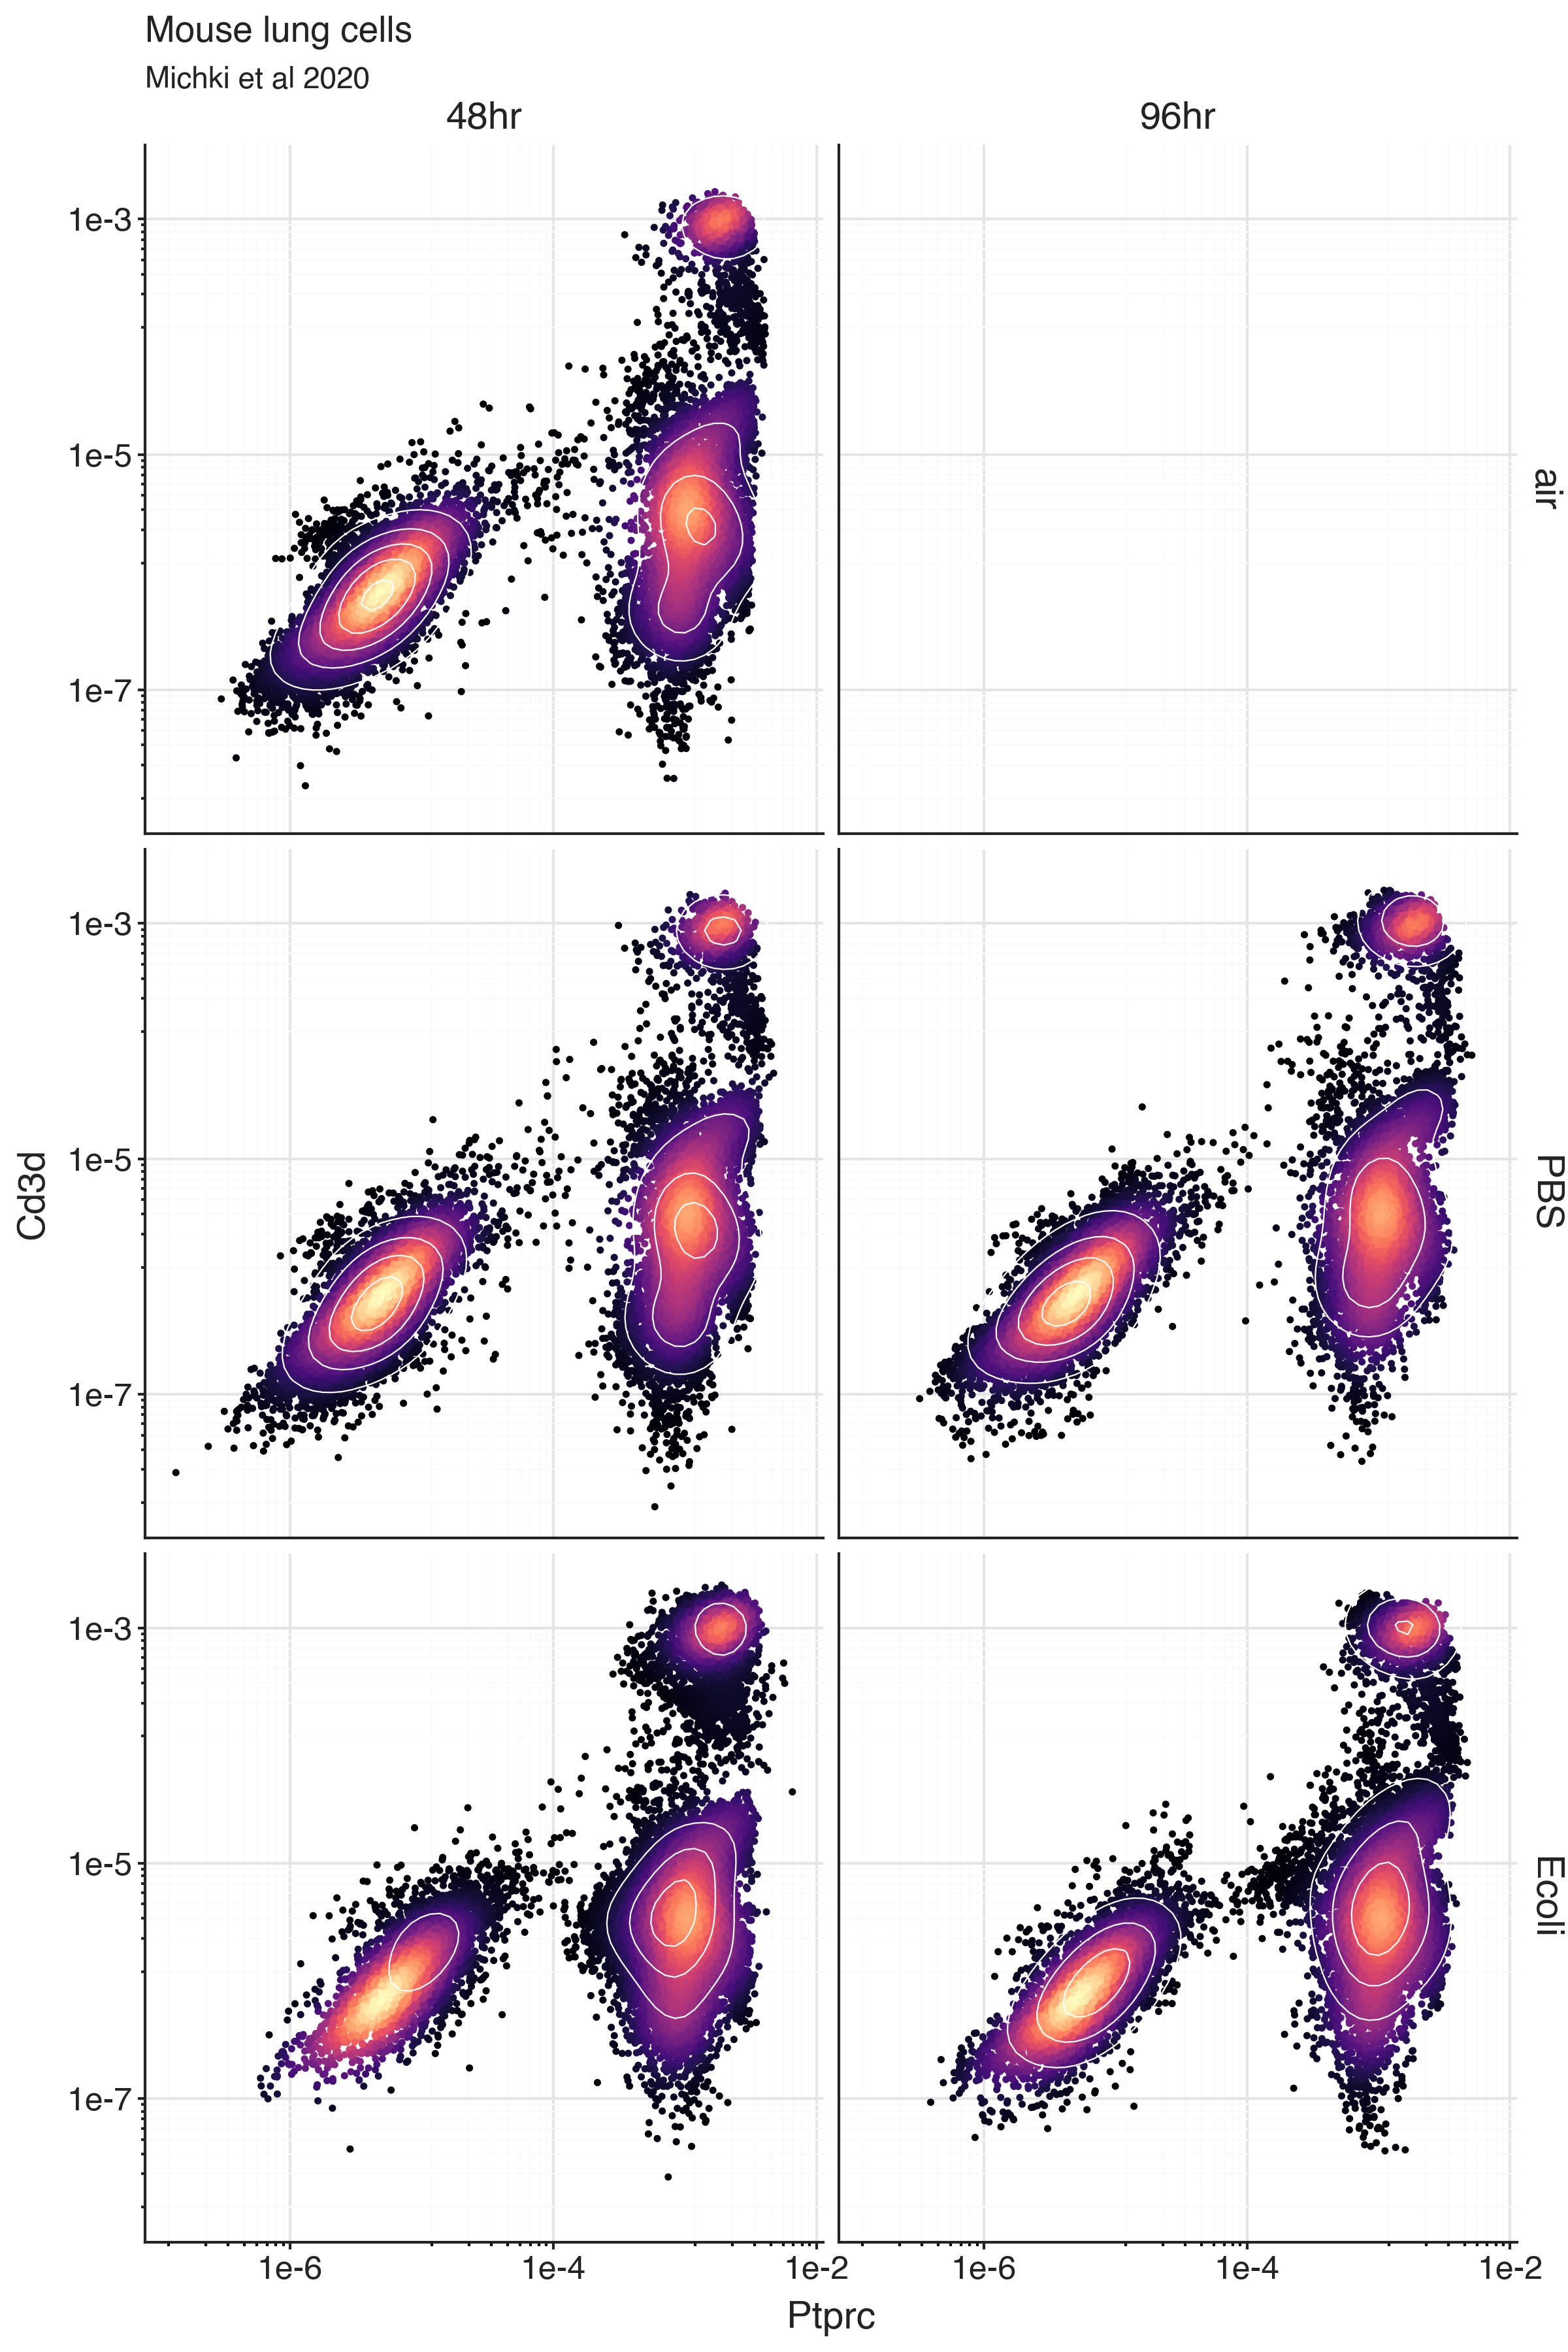
We can clearly see a population of cells with low Ptprc expression, and another population with high Ptprc expression. This is most likely a population of immune cells. We can also see, within the Ptprc high population, there is a subpopulation of cells with ‘high’ Cd3d expression. These are likely T cells.
The plot is faceted over experimental conditions to highlight the consistency of these ‘high’ and ‘low’ expressing populations are between samples. Nested within these highlighted experimental conditions are also neonatal and juvenile conditions, and biological replicates.
With the scRNA-seq data though, we can dive further into the Cd3d-high T cells. There are multiple subsets of T cells. This includes Th17 cells, an effector subset of CD4+ T helper cells which provides protection at barrier tissues (like in lungs) by secreting the cytokine IL-17, which in turn activates nearby cells to produce chemokines to recruit neutrophils.
Production of IL-17 is regulated by the transcription factor RORγt, which is encoded by the gene Rorc in mice. Expression of Rorc in T cells defines the ability to perform the IL-17 production function of Th17 cells. So we can look at the bivariate distribution of Cd3d expression and Rorc expression.
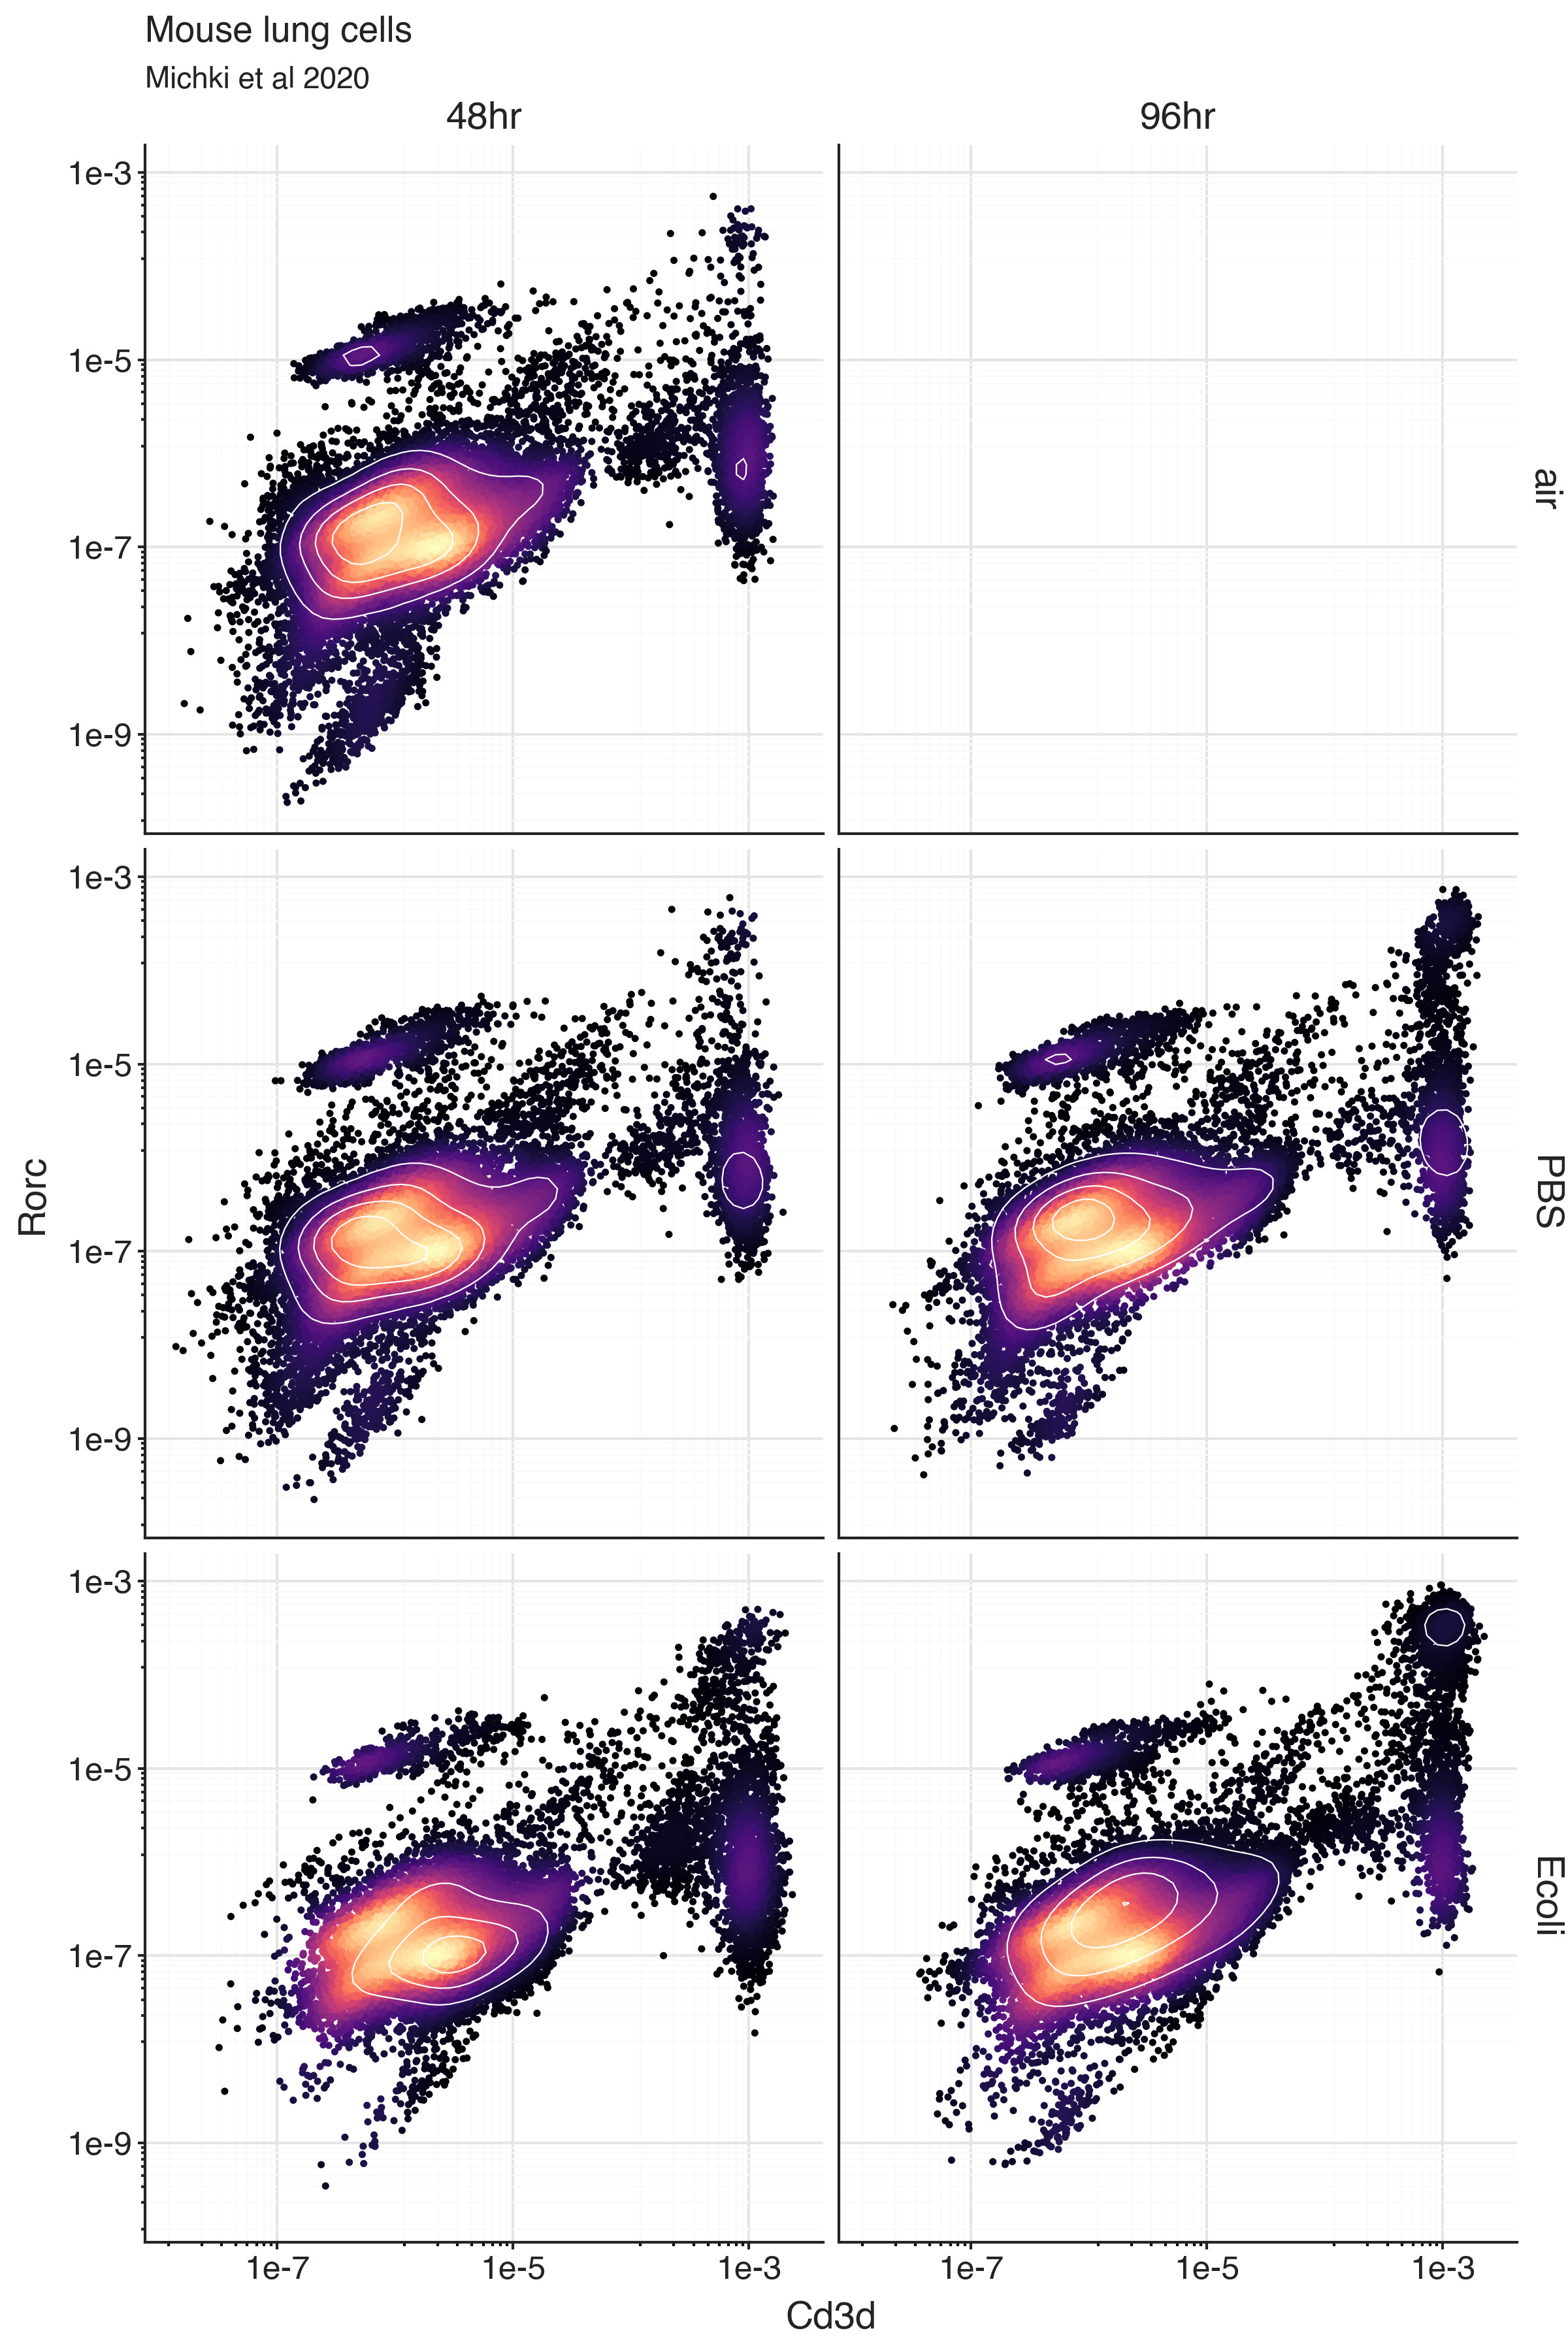
Within the Cd3d-high population of cells, we can see a number of cells with ‘high’ expression of Rorc, most likely indicating Th17 cells.
We can note from these examples that on the normalized relative abundance scale of gene expression, expression levels are never exactly 0. This is a fundamental property of the relative abundance scale the rho values are defined on that is used to model the observed counts.
The rho values can be interpreted as the probability of seeing a molecule from a given gene in a cell if you’d sample a new molecule. In this setting, a rho value of 0 is a very strong statement: it means it is impossible to see molecules from that gene. Instead, the values can be very low, making it extremely unlikely we’d see a molecule, yet still possible. A rho value of 1e-9 means that if we’d sample a billion molecules, we should only expect to see one molecule produced from the gene.
On the other hand, we can easily detect populations with ‘low’ or ‘high’ normalized expression in different genes. The subdivisions into subpopulations make sense on the relative scale defined by the full dataset. Even though we don’t have a clear threshold in the form of ‘if a gene has normalized expression value above X in a cell, it expresses the gene’.
What if we could have the model infer and report at which level a gene is definitely expressed?
With this, we could automatically set thresholds for when genes are actually expressed, and distinguish cells where we definitely should not expect to see a molecule from a gene, ever.
To learn what rho values an SCVI model considers as ‘0’, we can fit the model on a modified dataset where we artificially add a gene called ‘NULL_CONTROL’ that has observed 0 expression in all cells. Then we can decode the normalized expression rho for the ‘NULL_CONTROL’ in every cell.
For any real gene, we can compare it’s expression level in a cell to the expression level of ‘NULL_CONTROL’ in the same cell. If the gene expression is similar to the ‘NULL_CONTROL’ expression, the model can’t distinguish the expression level from 0 given the data.
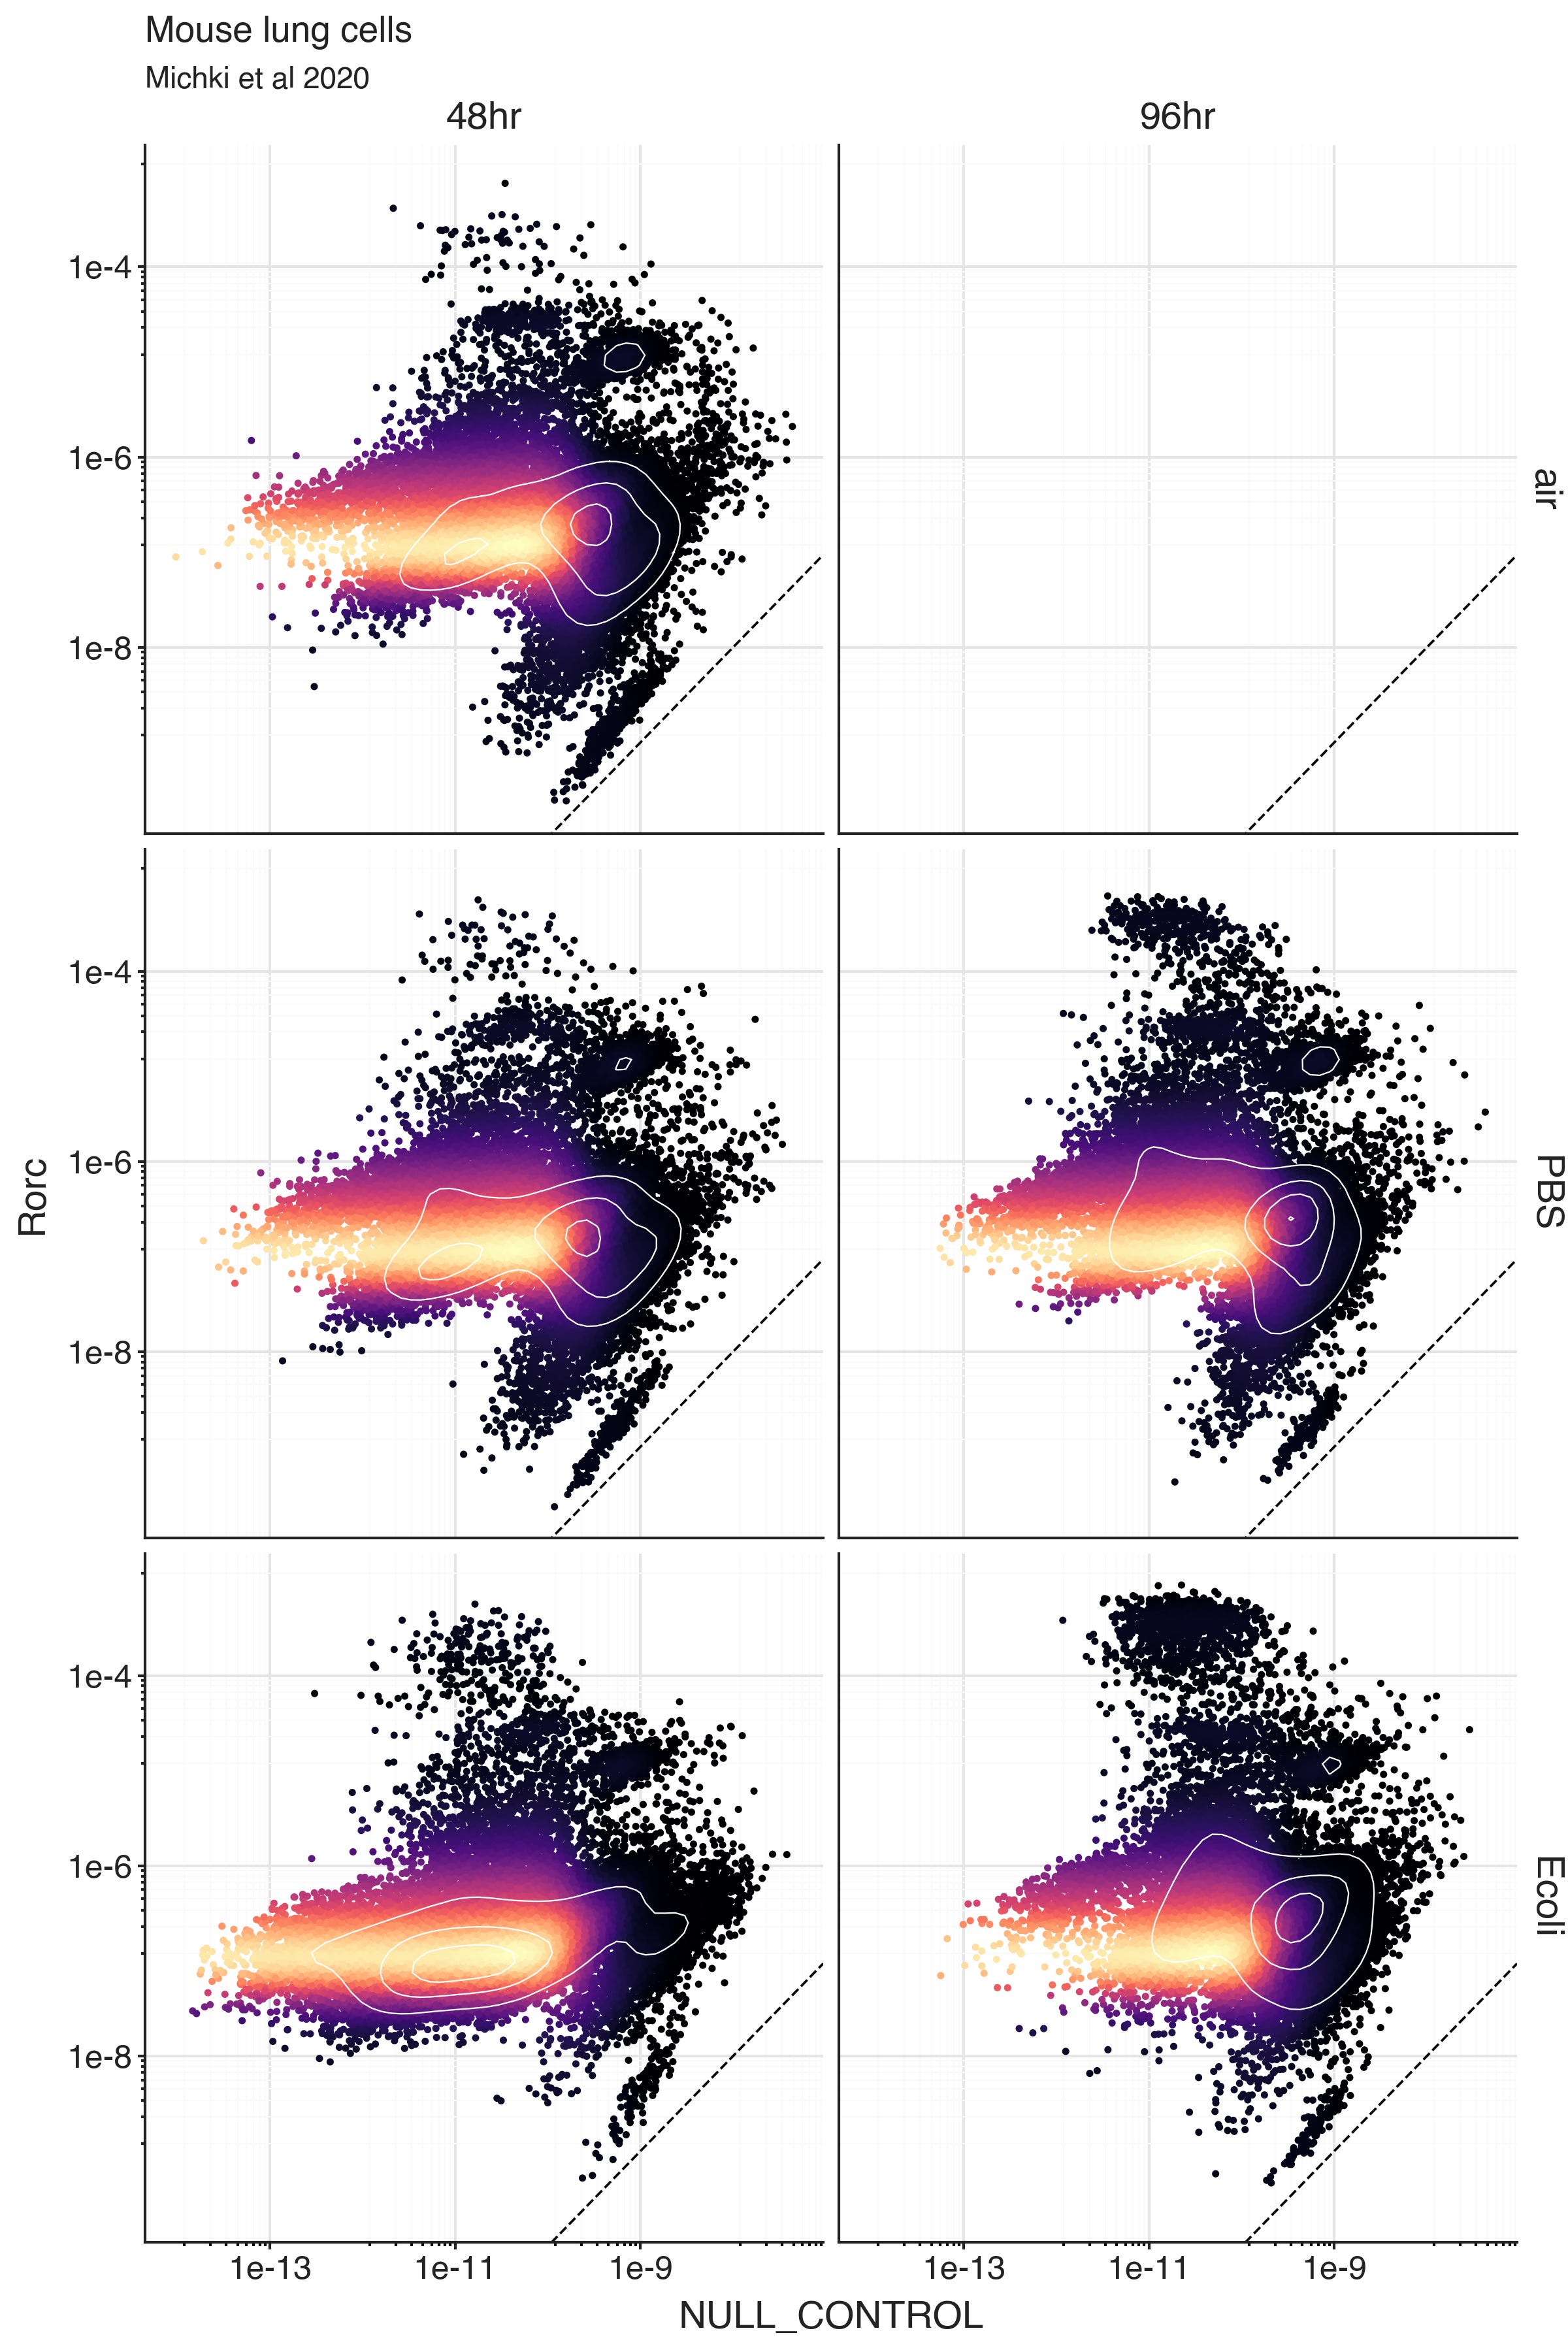
What we see though, is that the predicted expression levels from the artificial all-zero ‘NULL_CONTROL’ are extremely low in all cells. In the plots, the dashed line is a unit line, and Rorc expression is higher than ‘NULL_CONTROL’ expression in all cells.
Unfortunately, this means that this strategy won’t work to automatically define cells truly expressing a gene. The way the model sees it, you are more likely to see molecules from Rorc than from ‘NULL_CONTROL’. This is probably due to some very small number UMI’s being counted in a way that doesn’t respect the cell populations. This can happen due to experimental measurement reasons or spurious read assignment reasons. In the end, the data is informing the model that regardless the cell, there is a small (yet nonzero) chance to observed Rorc molecules. In a way, it is positive that the model is respecting the uncertainty in the true data.
Yet, our lives would be easier if we had a clear threshold for defining, for example, CD4+ T cells, or other cell types with known markers. Empirically, I have found that a threshold of 1e-4 is a good first guess at separating ‘high’ from ‘low’ expressing cells (meaning, it often reproduces known cell type hierarchies). The scale of the rho values will depend on how many genes are in the dataset the model is fitted to, and generally the complexity of the full population of cells.
This was a pretty quick experiment of adding the artificial ‘NULL_CONTROL’ before fitting an SCVI model. I felt the post needed to be quite long though, because I never see people describing these gene distribution explorations of scRNA-seq data, and outside the context of this relative expression -based workflow it’s not so clear why it would be useful to obtain true 0 thresholds.
Code and notebook for this analysis are available on Github
From around the web
