
SCVI — Integrating or not?

In modern single cell analysis workflows you fit a model to your data that allow you to ask questions about the data.
A common question is ‘which cells are similar to each other?’
In the SCVI modeling framework, vector representations of cells are learned so that similar vectors generate statistically similar transcriptional profiles. With some simplifications, the SCVI model is
The representations reflect the varying kinds of transcriptional profiles we can expect to see given the data. Groups of similar cells form dense regions in the representation space, which are often used to assign cell types or cell states that are not known when the data is collected.
On the other hand, information we do know about the cells is also often reflected in the representation space. If you collect cells from a healthy person, as well as from a person undergoing an immune challenge, many of the immune cells in the blood will have different transcriptional profiles, reflecting their state changes as part of the immune response. In cell representation space, B cells from the healthy person will be in a different area than B cells from a person with an infection.
In the SCVI modeling framework, if you have kept track of which cell comes from which person, you can learn cell representation that does not include the variation due to the difference between the persons. With some simplifications, the SCVI model with integration can be be written as
Should you do this?
This depends on the questions you want to find answers to using the cell representations.
You might want to learn which cells are B cells, and count how many there are from each person. This assumes there is a definition of B cells that is shared between the two people. At this point you are not interested in the different states of the B cells from the two people. If you learn representations that integrate out the differences between the blood donors, B cells will form densities in cell representation space that is consistent between the donors.
Or, you might want to define specifically a B cell state that is present in a particular infection. Not all cell types may change state due to an infection, and you might want to find which cell types react to an infection by explicitly asking the question of whether the cells from the two people are separated in representation space when looking at a specific cell type.
This leads to a situation where you have to use two different models depending on the questions you want to answer.
It would be better to be able to answer all our different questions using a single model.
As an example, we can use the recently published Asian Immune Diversity Atlas (AIDA, Tian et al 2024). The complete dataset has 1.1 million blood cells collected from 503 donors. If we sample 50 donors, we end up with ~100k cells with 33 different cell types annotated. We can fit one SCVI model without integration, and one model where the variation between donors is integrated out.
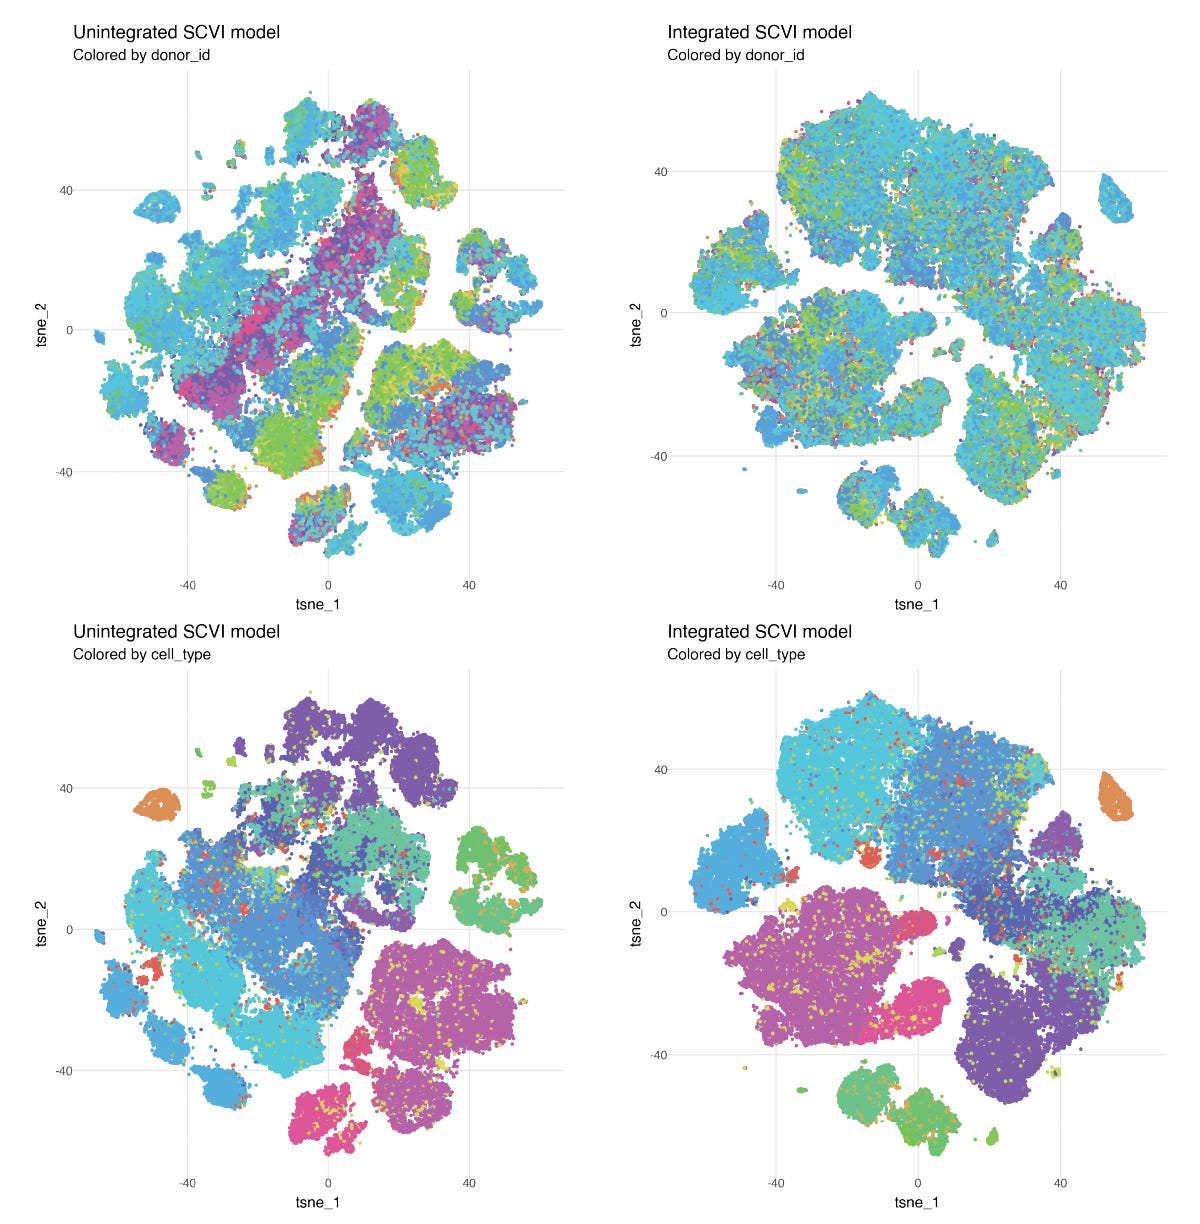
In the unintegrated version of the model, cell types split up by donor, reflecting variation between individuals, while in the integrated model we no longer see differences between individuals, but cell types are consistently defined.
Do both at once
The new MrVI model in scvi-tools solves this problem by learning two levels of variational representations of the cells (Boyeau et al 2024). With some simplifications, we can think of the MrVI model as
There are some additional important architecture differences from the SCVI model, but for the sake of the issue discussed here, this reflects the intuition behind the model. Importantly, there are two representation spaces for the cells: U and Z. The U-space reflects cell-cell variation with variation between samples integrated out. The interaction between sample-sample variation and cell-cell variation gets introduced when moving to the Z-space.
The result of this is that consistent definitions of cell types will be reflected in the U-space, while different states of the cell types will be reflected in the Z-space.
Now we can fit a single MrVI model to the AIDA data, and visualize the two different representations for the single cells.

Now with the MrVI model, the U-space have consistent cell types are consistently defined for all donors, while the Z space reflects variation between individuals for the different cell types.
References
Boyeau, Pierre, Justin Hong, Adam Gayoso, Michael I. Jordan, Elham Azizi, and Nir Yosef. 2022. “Deep Generative Modeling for Quantifying Sample-Level Heterogeneity in Single-Cell Omics.” bioRxiv. https://doi.org/10.1101/2022.10.04.510898.
Tian, Chi, Yuntian Zhang, Yihan Tong, Kian Hong Kock, Donald Yuhui Sim, Fei Liu, Jiaqi Dong, et al. 2024. “Single-Cell RNA Sequencing of Peripheral Blood Links Cell-Type-Specific Regulation of Splicing to Autoimmune and Inflammatory Diseases.” Nature Genetics 56 (12): 2739–52.
From around the web
