
Training SCVI — Differential expression over epochs

With a trained SCVI model you can perform differential expression analysis to learn which genes are increased and decreased in gene expression as cells change their states.
Previously, we looked at how posterior predictive distributions change during model fitting, where we saw that they stabilized after relatively few epochs.
Here, we want to see how differential expression results change as an SCVI model fits to a dataset.
As an example, we can use a recent dataset from Li et al. 2024. The paper describes identification of a population of stem-like T cells that are enriched in inflamed areas of the colon in patients with ulcerative colitis. The authors isolated T cells from colons of healthy donors and ulcerative colitis patients. From patients with active ulcerative colitis, they collected T cells from non-inflamed tissues and inflamed tissues from 10 patients. This is a nice experimental design that allows comparison of gene expression levels between the inflamed and non-inflamed tissues.
The authors annotated 11 different T cell subsets, but applying a filter to retain only T cell populations with at least 50 cells in both inflamed and non-inflamed tissues leaves eight subsets.
We fit the SCVI model to the full dataset, 15,411 cells with measurements of 14,203 genes. For the differential expression analysis we limit the cells only to the eight T cells subsets with sufficient cell numbers and the paired inflamed/non-inflamed tissues. We fit the SCVI model for a total of 100 epochs.
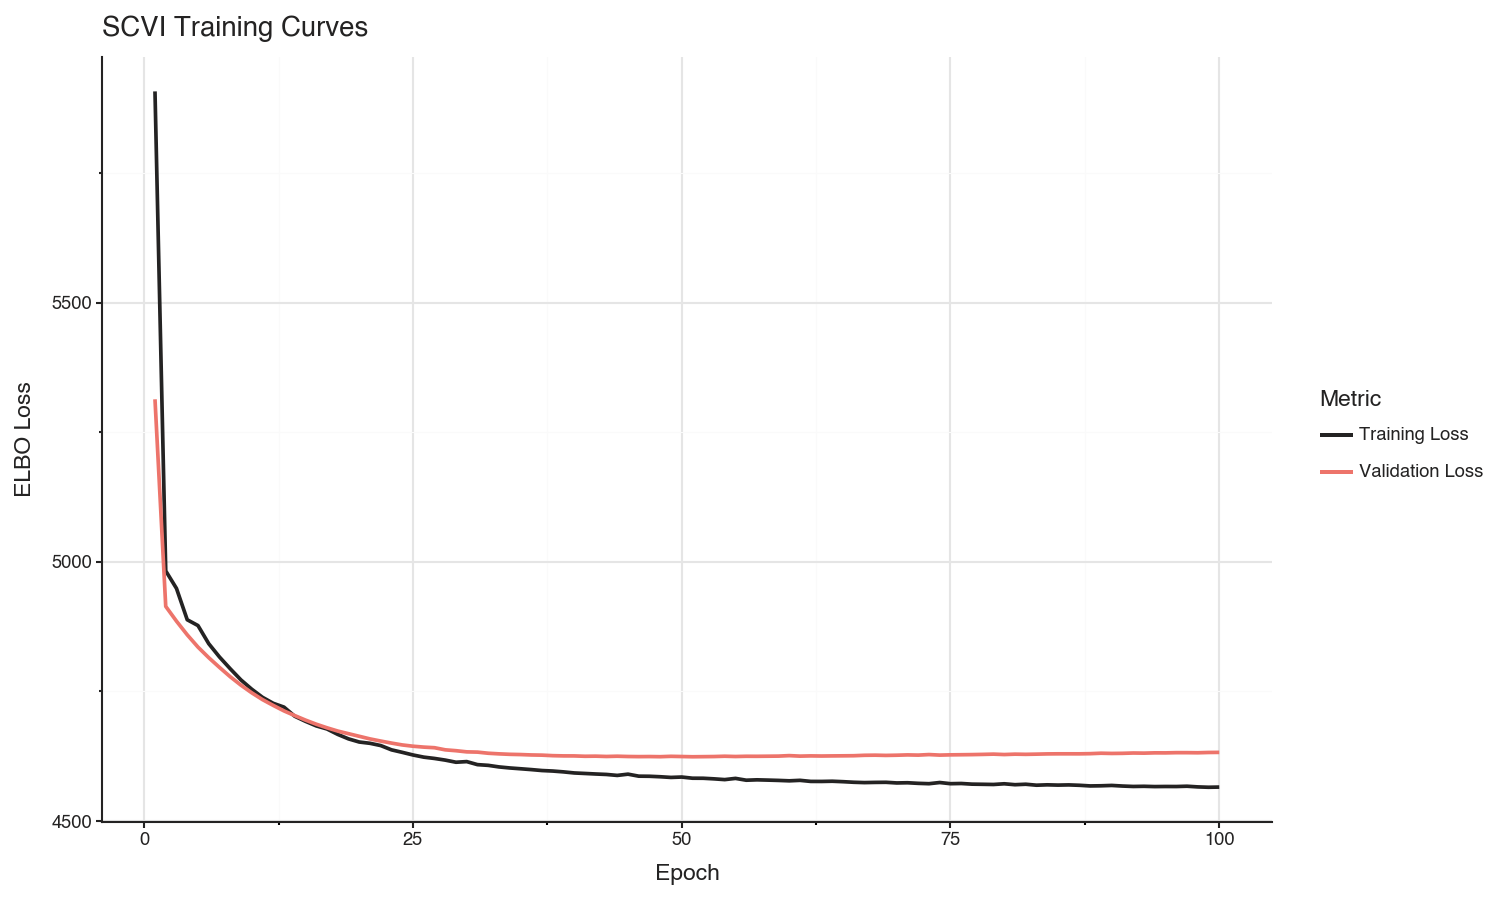
We can see in the loss curves that training set loss is still decreasing, but the validation set loss appears to have converged after about 50 epochs.
After each epoch, we stop training and perform differential expression analysis per cell type between inflamed and non-inflamed tissue. The results are stored, then visualized as volcano plots for each epoch. To see how the results change, we convert them to an animation that can be viewed below:
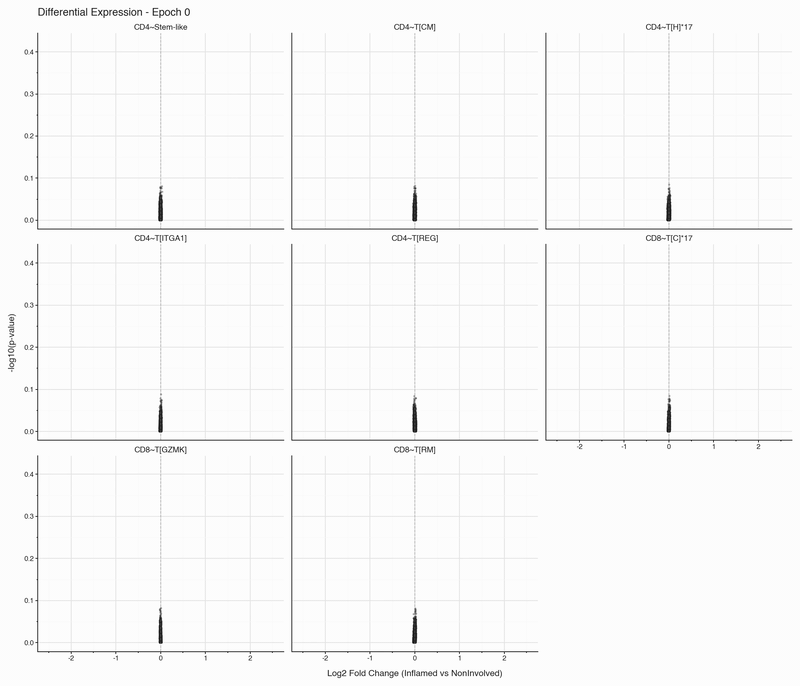
Over the first 10 epochs, the results are changing dramatically. Following these epochs though, the results do not appear to change systematically. We do see that estimated fold changes and p-values vary between epochs. P-values change more than log2 fold changes between epochs; after convergence (epoch 50), log2 fold changes have a standard deviation of 0.023 on average between epochs, which is well below observable variation. In this case, no genes have p-values smaller than 0.05
The log2 fold change estimation in the SCVI model stabilized faster than I had expected.
Scripts for performing the analysis and creating the visualizations are available on Github.
From around the web
