More interactive Python plotting with Clojure and Quil

The Python plotting library matplotlib is one of the libraries I read about a lot, and often, to try to keep track of everything possible to do with it. But I keep running in to situations where I don’t find it very useful.
Here I will write about one issue I had at a point, where I found it annoying when I wanted to sequentially build a graph, by adding scatter points to it one set at a time.
This summer I started playing with Clojure, and I enjoyed it quite a lot. Through looking at presentations for this I found Quil. I’ve only at some points played with Processing before, and I feel like quil better fits my way of thinking.
So, what I want, is to to my regular things with point data in IPython Notebook, and when I want to add it to a graph, I want to just send it to a quil sketch which is just running to the side of my IPython window. This way I can build my graphs over time.
I enjoy working with MongoDB, it has a tendency to just work where I need it and it is easy get started with. So I used this as a backend, and connected my quil sketch to the database using the monger library, which is extremely simple to use.
Here follows the entire code for the quill sketch that does what I want:
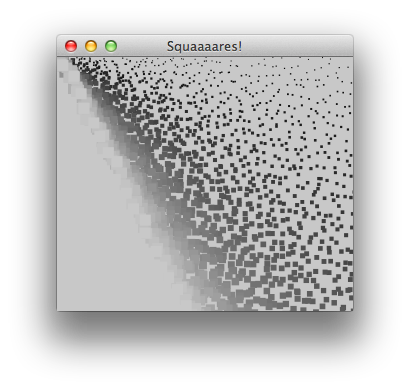
(ns square-vis.core (:gen-class) (:require [monger.core :as mg]) (:require [monger.collection :as mc]) (:use monger.operators) (:use quil.core)) (mg/connect!) (mg/set-db! (mg/get-db "test")) (defn draw-square [doc] (let [size (get doc :size) x (get (get doc :coord) 0) y (get (get doc :coord) 1) c (get doc :c)] (no-stroke) (fill c) (rect x y size size))) (defn -main [& args]) (defn setup [] (smooth) (frame-rate 30) (background 200)) (defn draw [] (background 200) (doseq [item (mc/find-maps "squares")] (draw-square item))) (defsketch example :title "Squaaaares!" :setup setup :draw draw :size [323 200])
This is only for making scatter plots with squares, in grayscale, which I like a lot. This piece of code connects to a database called “test”, and searches for documents in the collection named “squares”, and give them as Clojure maps, so they are easy to use in the rest of the sketch. The documents in the collection represents squares, with the following schema.
square = {'coord': [10, 20], 'size': 8, 'c': 155}
Some small examples:
from pymongo import Connection conn = Connection() coll = conn['test']['squares'] for i in range(28): for j in range(22): square = {'coord': [10 + 10 * i, 20 + 10 * j], 'size': 5, 'c': (i * j) ** 2 % 251} coll.insert(square)

coll.drop() for k in linspace(0.0, 2.0): x = np.linspace(1, 350) y = k * x for xi, yi in zip(x, y): doc = {'coord': [xi, yi], 'size': 5 * k + 1, 'c': 100 * k} coll.save(doc)

print('running') while True: try: for doc in coll.find(): doc['coord'][0] += 1 * (random.random() - 0.5) doc['coord'][1] += 1 * (random.random() - 0.5) coll.save(doc) except KeyboardInterrupt: print('done') break