High contrast stacked distribution plots

A while ago a colleague showed me an image of a beautiful way of plotting several distributions to make them easily comparable. I have since failed to find these plots or managed to figure out what they are called. But the concept was to plot densities for several variables in such a way that they appeared behind each other in depth.

Let me first illustrate the effect before we get to an implementation.

%pylab inline
import pandas as pd
import seaborn as sns
sns.set_style('white')

xx = np.linspace(0, 4 * np.pi, 512)


We just make some random sinus curves for illustration

df = pd.DataFrame()
for i in range(1, 32):
    df[i] = np.sin((np.random.rand() + 0.5) * xx) + 1

figsize(16, 16)
for i, ind in enumerate(df):
    offset = 1.1 * i
    plt.fill_between(xx, df[ind] + offset, 0 * df[ind] + offset,
                     zorder=-i,
                     facecolor='k',
                     edgecolor='w',
                     lw=3)

sns.despine(left=True, bottom=True)
plt.xticks([])
plt.yticks([]);

plt.savefig('plots/1.png');

There are just a few small tricks to the effect. The zorder=-i parameter makes the curves stack in the correct order. Making the edge colors the same color as the background gives the effect of depth. Personally I like the very high contrast style of using black fills. (Another colleague who saw these plots called them “Moomin plots” )

You can also make some pretty, regular, patterns with this look.

df = pd.DataFrame()
for i in range(1, 16):
    df[i] = np.sin(i * xx) + 1

figsize(14, 8)
for i, ind in enumerate(df):
    offset = 1.1 * i
    plt.fill_between(xx, df[ind] + offset, 0 * df[ind] + offset,
                     zorder=-i,
                     facecolor='k',
                     edgecolor='w',
                     lw=3)

sns.despine(left=True, bottom=True)
plt.xticks([])
plt.yticks([]);

plt.savefig('plots/2.png');

So how can we plot distribution for comparison with this technique? First let us create some simulated data. In this case I’m randomly mixing unimodal and bimodal normally distributed data, this is what a lot of the data we study in my research group looks like. Letting the mean be between 0 and 16 is arbitrary of course, and I just picked the variance to be 2 because I thought it looked good.

def unimodal():
    m = random.randint(0, 16)
    return random.randn(256) * 2 + m

def bimodal():
    m1 = random.randint(0, 16)
    s1 = random.randn(128) * 2 + m1
    m2 = random.randint(0, 16)
    s2 = random.randn(128) * 2 + m2
    return np.hstack((s1, s2))

df = pd.DataFrame()
distributions = [unimodal, bimodal]
for i in range(16):
    distribution = random.choice(distributions)
    df[i] = distribution()


We’ll use the Gaussian KDE from scipy for this.

from scipy.stats import kde


Now we pick an x-axis which should cover the entire range of the data in all the columns of the DataFrame we keep the data in.

We handle the y-offsets of the data by picking half the height of the previous density plot. This can be tweaked and give slightly different effect dependong on what fraction of the height is used. I found half height to be most generally good looking though.

To make it easy to relate a label to a distribution we plot a line the density can “rest on”. If it is thick enough it will give the effect of the density growing up from it.

figsize(6, 8)
xx = np.linspace(df.min().min(), df.max().max(), 256)
yy = None
offset = 0
offs = [offset]
for i in df:
    if yy is not None:
        offset += 0.5 * yy.max()
        offs.append(offset)

    s = df[i]
    f = kde.gaussian_kde(s)
    yy = f(xx)

    plt.fill_between(xx, yy + offset, 0 * yy + offset,
                     zorder=-i,
                     facecolor='k',
                     edgecolor='w',
                     lw=3)

    plt.axhline(y=offset,
                zorder=-i,
                linestyle='-',
                color='k',
                lw=4)

sns.despine(left=True, bottom=True)
plt.yticks(offs, ['Sample {}'.format(s + 1) for s in df.columns]);

plt.tight_layout()
plt.savefig('plots/3.png');

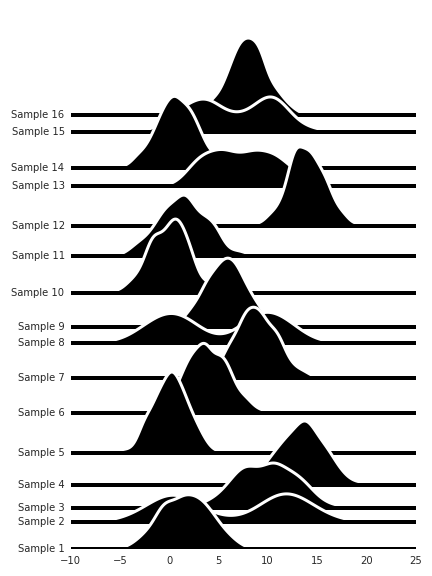
I like these a lot, though it looks a bit messy. Of course, with real data the ordering of the variables on the y-axis would be informed by some prior knowledge so that trends could be easily spotted.

But even so, if we don’t know how we should order these for easy comparison between the distributions, we can use hierarchical clustering to arrange the distribution so they become more comparable.

import fastcluster as fc
from scipy.cluster.hierarchy import dendrogram

figsize(6, 8)

link = fc.linkage(df.T, method='ward')
dend = dendrogram(link, no_plot=True)
dend['leaves']

xx = np.linspace(df.min().min(), df.max().max(), 256)
yy = None
offset = 0
offs = [offset]
for i, ind in enumerate(df[dend['leaves']]):
    if yy is not None:
        offset += 0.5 * yy.max()
        offs.append(offset)

    s = df[ind]
    f = kde.gaussian_kde(s)
    yy = f(xx)

    plt.fill_between(xx, yy + offset, 0 * yy + offset,
                     zorder=-i,
                     facecolor='k',
                     edgecolor='w',
                     lw=3)

    plt.axhline(y=offset,
                zorder=-i,
                linestyle='-',
                color='k',
                lw=4)

sns.despine(left=True, bottom=True)
plt.yticks(offs, ['Sample {}'.format(s + 1) for s in df[dend['leaves']].columns]);

plt.tight_layout()
plt.savefig('plots/4.png');

Extract Cluster Elements by Color in Python Dendrograms

One aspect of using Python for data analysis is that hierarchical clustering dendrograms are rather cumbersome to work with. Both in terms of plotting next to a heatmap, and how to relate the input data to the resulting plot. Ideally the dendrogram function would return a proper instances of some Dendrogram class. But let’s work with what we have.

There are plenty (1, 2) of guides around on how to make R inspired heatmaps with dendrograms. Here I will describe how to parse out the cluster members as seen in a dendrogram, which can be handy if one notices interesting patterns in the corresponding heatmap.

Let’s start with importing some modules.

%pylab inline

from collections import defaultdict

import pandas as pd
from scipy.cluster.hierarchy import dendrogram, set_link_color_palette
from fastcluster import linkage
import seaborn as sns
from matplotlib.colors import rgb2hex, colorConverter

numpy.random.seed(0025)


We also set some prettier non-default colours.

sns.set_palette('Set1', 10, 0.65)
palette = sns.color_palette()
set_link_color_palette(map(rgb2hex, palette))
sns.set_style('white')


We should create some simple example data for the purpose of illustration.

x, y = 3, 10
df = pd.DataFrame(np.random.randn(x, y),
                  index=['sample_{}'.format(i) for i in range(1, x + 1)],
                  columns=['gene_{}'.format(i) for i in range(1, y + 1)])

link = linkage(df, metric='correlation', method='ward')

figsize(8, 3)
den = dendrogram(link, labels=df.index, abv_threshold_color='#AAAAAA')
plt.xticks(rotation=90)
no_spine = {'left': True, 'bottom': True, 'right': True, 'top': True}
sns.despine(**no_spine);


The dendrogram function will return a dictonary containing a representation of the tree as plotted.

den

{'color_list': ['#c13d3f', '#AAAAAA'],
 'dcoord': [[0.0, 0.70210454159043401, 0.70210454159043401, 0.0],
  [0.0, 1.1003608323279817, 1.1003608323279817, 0.70210454159043401]],
 'icoord': [[15.0, 15.0, 25.0, 25.0], [5.0, 5.0, 20.0, 20.0]],
 'ivl': ['sample_3', 'sample_1', 'sample_2'],
 'leaves': [2, 0, 1]}


The tree is represented as a collection of ∏ shaped components.

The three items named color_list, dcoord, icoord indexes these ∏’s

Obviosly color_list contains the colors. The lists in dcoord contain the y coordinates of the ∏’s (the distances) while icoord has the x coordinates. These would be the index coordinates.

In the minimal example above we have two ∏’s, and one can see that the x-coordinates are repeated once.

The coordinates go from left to right. So for the red ∏, the ‘legs’ are located at 15 and 25, while the grey one has legs at 5 and 20.

The apperant pattern is that legs positioned at leaves will end with 5. The reason is to nicely place the leg at the middle of the corresponding leaf index value. This also implies the actual list indices of the leaf are multiplied by 10.

Thus we first subtract 5 from each colors icoord, then divide by 10. If the resulting number is close to the closest integer, we consider this to be an index for a leaf. If the resulting number is not close to an integer index, it means the colored tree we got it from is from non-leaf parts of the trees.

For each leaf, we add it to a list per color in a dictionary.

cluster_idxs = defaultdict(list)
for c, pi in zip(den['color_list'], den['icoord']):
    for leg in pi[1:3]:
        i = (leg - 5.0) / 10.0
        if abs(i - int(i)) < 1e-5:
            cluster_idxs[c].append(int(i))

cluster_idxs

defaultdict(<type 'list'>, {'#c13d3f': [1, 2], '#AAAAAA': [0]})


Next we need to grab the labels of the leaves given the indexes. But before we do that, since it’s difficult to keep track of what color e.g. #c13d3f is, we make make an IPython notebook compatible HTML representation of the dictionary holding the information. Objects of this class will behave just like dictionaries, except for representing them as a HTML table.

class Clusters(dict):
    def _repr_html_(self):
        html = '<table style="border: 0;">'
        for c in self:
            hx = rgb2hex(colorConverter.to_rgb(c))
            html += '<tr style="border: 0;">' \
            '<td style="background-color: {0}; ' \
                       'border: 0;">' \
            '<code style="background-color: {0};">'.format(hx)
            html += c + '</code></td>'
            html += '<td style="border: 0"><code>' 
            html += repr(self[c]) + '</code>'
            html += '</td></tr>'

        html += '</table>'

        return html


(Note that the representation uses colerConverter from matplotlib, so it supports any matplotlib supported color representation, not only hex color strings.)

Now just go through the list of indices and fetch labels.

cluster_classes = Clusters()
for c, l in cluster_idxs.items():
    i_l = [den['ivl'][i] for i in l]
    cluster_classes[c] = i_l

cluster_classes


#c13d3f['sample_1', 'sample_2']
#AAAAAA['sample_3']


Let’s combine this to a nice reusable function, and try it out on a larger example.

def get_cluster_classes(den, label='ivl'):
    cluster_idxs = defaultdict(list)
    for c, pi in zip(den['color_list'], den['icoord']):
        for leg in pi[1:3]:
            i = (leg - 5.0) / 10.0
            if abs(i - int(i)) < 1e-5:
                cluster_idxs[c].append(int(i))

    cluster_classes = Clusters()
    for c, l in cluster_idxs.items():
        i_l = [den[label][i] for i in l]
        cluster_classes[c] = i_l

    return cluster_classes

x, y = 96, 10
df = pd.DataFrame(np.random.randn(x, y),
                  index=['sample_{}'.format(i) for i in range(1, x + 1)],
                  columns=['gene_{}'.format(i) for i in range(1, y + 1)])

link = linkage(df, metric='correlation', method='ward')

figsize(12, 4)
den = dendrogram(link, labels=df.index, abv_threshold_color='#AAAAAA')
plt.xticks(rotation=90)
sns.despine(**no_spine);


get_cluster_classes(den)


#c13d3f['sample_20', 'sample_87', 'sample_35', 'sample_2', 'sample_24', 'sample_13', 'sample_6', 'sample_82', 'sample_11', 'sample_12', 'sample_44', 'sample_94', 'sample_73', 'sample_77', 'sample_76']
#4e7ca1['sample_56', 'sample_81', 'sample_69', 'sample_9', 'sample_27', 'sample_21', 'sample_45', 'sample_52', 'sample_59', 'sample_46', 'sample_93', 'sample_10', 'sample_48', 'sample_78', 'sample_14', 'sample_50', 'sample_31', 'sample_91', 'sample_75', 'sample_86', 'sample_84', 'sample_55', 'sample_88', 'sample_43', 'sample_58', 'sample_33', 'sample_96', 'sample_34', 'sample_19', 'sample_68', 'sample_21']
#8e5d93['sample_4', 'sample_92', 'sample_15', 'sample_54', 'sample_1', 'sample_17', 'sample_42', 'sample_79', 'sample_41', 'sample_57', 'sample_63', 'sample_67', 'sample_22', 'sample_64', 'sample_83', 'sample_30', 'sample_53', 'sample_26', 'sample_3', 'sample_29', 'sample_28', 'sample_36', 'sample_7', 'sample_80', 'sample_8', 'sample_5', 'sample_71', 'sample_65', 'sample_39', 'sample_62', 'sample_85']
#5e9d5c['sample_23', 'sample_38', 'sample_90', 'sample_51', 'sample_25', 'sample_60', 'sample_74', 'sample_18', 'sample_61', 'sample_32', 'sample_49', 'sample_37', 'sample_70', 'sample_66', 'sample_16', 'sample_95', 'sample_40', 'sample_72', 'sample_47', 'sample_89', 'sample_40']


There is also an IPython notebook version of this post here

Riemannian Newton iteration for Rayleigh quotients on the sphere

In the above figure, each point is in initial value which will be converge to different eigenvectors of an orthogonal 3x3 matrix. The above figure is the equivalent of a Newton fractal, but applied to Rayleigh quotient iteration on a sphere. This post will go through an explanation of the figure, and the numerical method on the sphere, which can be applied to any manifold.

Rayleigh quotients and Eigenvectors

Given a Hermetian matrix \( M \) and a vector \( x \) the Rayleigh quotiend is defined by

$$ R(M, x) = \frac{x^TMx}{x^T x} $$

For the sake of this text, let us limit ourselves to looking at \( M = A^T A \) which are covariance matrices of some data matrix \( A \). This implies that \( M \) has unique real values eigenvalues. In addition we know that the eigenvectors of \( M \) will be orthogonal.

Using these eigenvectors as a basis, let us express an arbitrary vector \( x \) as a linear combination of eigenvectors.

$$ x = \sum_{i = 1}^n \alpha_i v_i $$

Now we have that

$$ R(M, x) = \frac{x^T A^T A x}{x^T x} = \frac{x^T A^T A x}{x^T x} = $$

$$ = \frac{\left(\sum_{j = 1}^n \alpha_j v_j\right)^T \left( A^T A \right) \left(\sum_{i = 1}^n \alpha_i v_i\right)} {\left(\sum_{j = 1}^n \alpha_j v_j\right)^T \left( \sum_{i = 1}^n \alpha_i v_i \right)} = $$

$$ = \frac{\sum_{i = 1}^n \alpha_i^2 \lambda_i}{\sum_{i = 1}^n \alpha_i^2} = \sum_{i = 1}^n \lambda_i \frac{(x^T v_i)^2}{(x^T x)(v_i^T v_I )} $$

since eigenvectors are orthogonal. Additionally, we see that the sum in the last equality will be minimized when \( x \) is orthogonal to the majority of the \( v_i \)’s. Which is locally the case for any \( x = v_j \), and globally when the eigenvector \( v_j \) corresponds to the smallest eigenvalue.

As \( R(M, x) \) is unaffected by lengths of vectors (due to division by the scalar product) it is defined on the sphere \( S^{n - 1} \), which is a Riemannian manifold.

$$ R(M, \cdot) : S^{n - 1} \rightarrow \mathbb{R} $$

Newton Iteration

The Newton Method of iteration is defined in \( \mathbb{R}^n \) by the procedure

  1. Solve \( D(\text{grad } \ f)(x)[\eta_x] = -\text{grad } \ f(x) \) for \( \eta_x \)
  2. Set \( x_{i + 1} := x_i + \eta_x \)

In each update of the iteration we solve for the update vector \( \eta_x \). Optimal points are found by finding the roots of the derivative of the function. Newton iteration is used to find local optima of differentiable functions by in each step making a local second order Taylor approximation of the given function. Since Newton iteration will have information about the local curvature it is normally quicker to converge than gradient descent.

A very classical assignment in courses on numerical methods is to implement the Newton method for root finding to find the complex roots of a polynomial. Usually this entails looking at which root the algorithm will find depending on initial condition. The result is the so called Newton Fractal. (Note that in this case we are looking for the roots of the function in question. For optimizing by finding stationary points we need to look at the derivative of the given function.)

For example, let us find the complex roots of the polynomial \( p(x) = x^3 - 1 \). The iteration becomes

  1. Solve \( p(x_k) + p’(x_k) \cdot \Delta x_k = 0 \) for \( \Delta x_k \)
  2. Set \( x_{k + 1} := x_k + \Delta x_k \)

Or in other words

$$ x_{k + 1} = x_k - \frac{x_k^3 - 1}{2x_k^2} $$

We can simply implement this iteration in the following fashion using Python with NumPy.

f = np.poly1d([1, 0, 0, -1])  # x^3 - 1
fp = np.polyder(f)

def newton(x, y, max_iters):
    c = complex(x, y)
    for i in range(max_iters):
        c = c - f(c) / fp(c)
        if np.abs(f(c)) < 1e-4:
            return c

    return 0.0


Now let us use this to illustrate the dependence on the initial value of the iteration. We simply define a function which performs the iteration until convergence over a grid of starting values in the complex plane. We color the grid by which root is found.

def create_newton_fractal(min_x, max_x, min_y, max_y, image, iters):
  height = image.shape[0]
  width = image.shape[1]

  pixel_size_x = (max_x - min_x) / width
  pixel_size_y = (max_y - min_y) / height

  for x in range(width):
    real = min_x + x * pixel_size_x
    for y in range(height):
      imag = min_y + y * pixel_size_y
      color = newton(real, imag, iters)
      image[y, x] = color.imag + 1


This can be generalized to work on any Riemannian manifold \( \mathcal{M} \) with an affine connection \( \nabla \) to optimize real valued functions \( f \). Define the Hessian by

$$ \text{Hess} \ f(x_k):= \nabla_{\eta_k} \text{grad } \ f. $$

Also let \( R : T\mathcal{M} \rightarrow \mathcal{M} \) be a retraction on \( \mathcal{M} \), a smooth mapping which satisfies

  1. \( R(0_x) = x \), where \( 0_x \) is the origin of \( T_x\mathcal{M} \)
  2. \( \frac{d}{dt} R(t \xi_x) \vert_{t=0} = \xi_x \)

Now we can define the new iteration method by

  1. Solve \( \text{Hess} \ f(x_k) \eta_k = -\text{grad } \ f(x_k) \) for \( \eta_k \in T_{x_k} \mathcal{M} \)
  2. Set \( x_{k + 1} := R_{x_k}(\eta_k) \)


Newton Iteration on Spheres

As a first step towards working on the sphere, we need to look at how the iteration would work for manifolds which are sub-manifolds of \( \mathbb{R}^n \). In this case we pick \( \nabla \) to be the Levi-Civita connection. What we need is a way of calculating the gradient in \( \mathcal{M} \).

Every vector \( z \in T_x \mathbb{R}^n \cong \mathbb{R}^n \) admits a decomposition \( z = P_x z + P^\perp_x z \) where \( P_x z \in T_x\mathcal{M} \) and \( P^\perp_x z \in T^\perp_x\mathcal{M} \); the orthogonal complement to \( T_x\mathcal{M} \) in \( \mathbb{R}^n \). Now say that \( \bar{f} : \mathbb{R}^n \rightarrow \mathbb{R} \), and the function \( f \) is defined by the restriction \( f = \bar{f} \vert_\mathcal{M} \). Then the gradient can be calculated by

$$ \text{grad } \ f(x) = P_x \ \text{grad } \ \bar{f}(x) $$

Using this identity, we can now realize the Levi-Civita connection by

$$ \nabla_{\eta_k} \text{grad} \ f = P_{x_k} \text{D} (\text{grad} \ f(x_k))[\eta_k] =: \text{Hess} \ f(x_k) \eta_k $$

So now in the step solving for \( \eta_k \in T_{x_k} \mathcal{M} \) we need to know a partitioning.

Let us now pull back from this abstraction and consider the particular case when \( \mathcal{M} = S^{n - 1} \) as a sub-manifold of \( \mathbb{R}^n \). That means in this case we have \( f : S^{n - 1} \rightarrow \mathbb{R}^n \). We let the partitioning projection \( P_x \) in to \( T_x S^{n - 1} \) be defined by

$$ P_x := \left( I - xx^T \right). $$

(A projection to the orthogonal complement of the vector projection onto \( x \))

We now have the iteration defined by

1: Solve

$$ P_{x_k} \text{D}(\text{grad} \ f)(x_k)[\eta_k] = -\text{grad} f(x_k) $$

for \( \eta_k \in T_x S^{n - 1} \cong \mathbb{R}^n \)

2: Step and retract back to the sphere by setting

$$ x_{k + 1} := \frac{x_k + \eta_k}{\Vert x_k + \eta_k \Vert} $$

Newton Iteration of Rayleigh quotient

We now have all the necessary tools to solve the eigenvector problem by minimizing the Rayleigh quotient. For gradient evaluation, as \( \frac{\partial}{\partial x_j}(x^T x) = 2x_j\) and \( \frac{\partial}{\partial x_j}(x^T M x) = 2(Mx)_j \) it follows that

$$ \text{grad} \ R(M, x) = \frac{2}{x^T x} \left( Mx - R(M, x) \cdot x \right) $$

This leads to the Newton equation

$$ P_{x_k} M P_{x_k} \eta_k - \eta_k x_k^T M x_k = -P_{x_k} M x_k $$

We know have a concrete iteration method which we can implement and run using Python

I = np.eye(3)

# Retraction at x
def R(x, eta):
    return (x + eta) / linalg.norm(x + eta)

# Small helper function
def f(A, x):
    return dot(x.T, dot(A, x))

# Projection P
def P(xk):
    return I - outer(xk, xk)

# Make a random orthogonal matrix
A = random.randint(0, 10, (3, 3))
A = dot(A, A.T)

# Pick starting point
x0 = np.array([0,-1,0])
xk = x0

# Iterate and store path
path = [xk]
for i in range(10):
    Pxk = P(xk)
    M = (Pxk.dot(A).dot(Pxk) - f(A, xk) * I)
    y = -Pxk.dot(A).dot(xk)
    eta_k = linalg.solve(M, y)
    path.append(xk + eta_k)
    xk = R(xk, eta_k)
    path.append(xk)


Let us plot the path of the iteration over the sphere, in the following plot blue lines mean \( x_k + \eta_k \) (updates in the tangent space) and orange lines \( R_{x_k}(\eta_k) \) (retraction to the sphere).

In this case the iteration has already converged after five steps, the following five steps are also plotted, but are stable and can’t be seen. The iteration converges when the Rayleigh quotient is minimized, therefore, we have now found an eigenvector to the randomly chosen matrix A.

Now we have everything we need to generate the figure above. First we define a couple of functions.

def RNmS(A, x0):
    # Iteration
    N = 5
    xk = x0
    for k in range(0, N + 1):
        Pxk = P(xk)
        M = (Pxk.dot(A).dot(Pxk) - f(A, xk) * I)
        y = -Pxk.dot(A).dot(xk)
        eta_k = linalg.solve(M, y)
        xk = R(xk, eta_k)

    X = A.dot(xk) / xk
    return X.mean()

def find_nearest_index(array, value):
    index = ((array.real - value.real) ** 2 + \
             (array.imag - value.imag) ** 2).argmin(0)

    return index


The we pick a matrix and calculate the eigenvalues with the standard algorithm for comparison.

# Choice of 3x3 symmetric matrix for which we want to find the eigenvectors/-values.
# Note that different matrices produce very different images.
A = random.randint(0, 10, (3, 3))
A = dot(A, A.T)

EW, EV = linalg.eig(A)
print "Eigenvalues: ", 
print EW


Finally we make a spherical grid, perform the iteration for every point in the grid, and plot the result.

# Resolution
n = 512
nj = n * 1j

# u and v are parametric variables.
u = r_[0:2*pi:nj]
v = r_[0:pi:nj]

x = outer(cos(u), sin(v))
y = outer(sin(u), sin(v))
z = outer(ones(size(u)), cos(v))

# Figure out which eigenvectors/-values the algorithm converges to
# for all the spherical initial vectors.
s = zeros((n, n))
for i in range(0, n):
    for j in range(0, n):
        try:
            X = RNmS(A, array([x[i, j], y[i, j], z[i, j]]))
            s[i, j] = find_nearest_index(EW, X)
        except:
            raise

print X

print "Indexes: ",
print set(s.flatten())

bmap = brewer2mpl.get_map('RdBu', 'Diverging', 3)
cmap = bmap.get_mpl_colormap(N=3, gamma=1.0)

figsize(50, 50)
fig = plt.figure()
ax = fig.add_subplot(111, projection='3d')
ax.set_aspect('equal')
ax.scatter(x, y, z, c=s, s=16, edgecolor='none', marker='s', cmap=cmap);
ax.axis("off");


References