Negative Binomial Factor Analysis by SGD
Principal component analysis works on the assumption that residual error from the linear model is Gaussian. To satisfy this in e.g. the case of scRNA-seq gene expression counts, it is common to log transform the counts with a "pseudocount" added to keep expression positive and deal with 0's.
Count models are fundamentally different from normally distributed models in that there is a relation between empirical mean and variance.
It is well known that a negative binomial noise model is appropriate for RNA-Seq sequencing counts. Previously I wrote about ZINB-WaVE by Risso et al, a factor analysis method which has a zero-inflated negative binomial noise model. The negative binomial distribution has two parameters, \( \mu \) - the mean of the disitribution - and \( \phi \), the overdispersion. If \( y \sim NB(\mu, \phi) \) then \( \mathbb{E}(Y) = \mu \) and \( \text{Var}(Y) = \mu + \frac{1}{\phi} \cdot \mu^2 \). The likelihood of this model is $$ \mathcal{L}_{NB}(y | \mu, \phi) = {{y + \phi - 1} \choose {y}} \cdot \left( \frac{\mu}{\mu + \phi} \right)^y \cdot \left( \frac{\phi}{\mu + \phi} \right)^\phi. $$
If we make the simplifying assumption \( \phi = 1 \) then the log likelihood simplifies to $$ \log \mathcal{L}_{NB}(y | \mu, 1) = y \cdot \log(\mu) - (y + 1) \cdot \log(\mu + 1) $$
From available datasets, it looks like this assumption might be a sensible thing. Let's look at the empirical mean variance relation for four representative datasets.

The mean variance relation seem to hold for a large number of genes, but not all. I think one way to deal with this is to consider a factor model similar to PCA for the \( \mu \) parameter, which should explain additional variance on top of the expected technical variance. Say that each gene \( g \) and cell \( c \) has its own mean \( \mu_{g, c} \). In matrix form, $$ \mu = \exp ( W x + E + \log(T) + S), $$ where \( W \) is a \( G \times N \) matrix of gene weights, \( x \) is an \( N \times C \) matrix of latent factors, \( E \) is a \( 1 \times C \) vector of cell specific scaling "efficencies", \( T \) is a \( 1 \times C \) vector of known cell specific scale factors, in this case the total number of counts in a cell, and \( S \) is a global scaling factor. (Here we pretend matrix-vector addition "broadcasts" like in NumPy / TensorFlow code.)
This can be fitted with stochastic gradient descent using TensorFlow as I wrote about in the case of PCA before. The full implementation is available here, but besides the data reading and mini-batching code, the key snippet of the TensorFlow model is the following:
...

## Model ##

W = tf.Variable(np.random.randn(G, N), name='weights')
x = tf.Variable(np.random.randn(N, S), name='PCs')
E = tf.Variable(np.random.randn(S), name='Efficiency')
S = tf.Variable(np.array([0.]), name='Scaling')

sample_idx = tf.placeholder(tf.int32, shape=[None])
variable_idx = tf.placeholder(tf.int32, shape=[None])
T_ = tf.placeholder(tf.float64, shape=[None])
y_ = tf.placeholder(tf.float64, shape=[None])


W_ = tf.gather(W, variable_idx)
x_ = tf.gather(tf.matrix_transpose(x), sample_idx)
eta_ = tf.reduce_sum(W_ * x_, 1)
E_ = tf.gather(E, sample_idx)

mu_ = tf.exp(eta_ + tf.log(T_) + E_ + S)

LL = tf.reduce_sum(y_ * tf.log(mu_) - (y_ + 1) * tf.log(mu_ + 1))

...
Performing the SGD model fitting takes about 20 seconds for datasets with several thousands of cells, using the top 3,000 expressed genes. Applying it to the data presented in the plot above using 2 hidden factors per cell, we get these results:
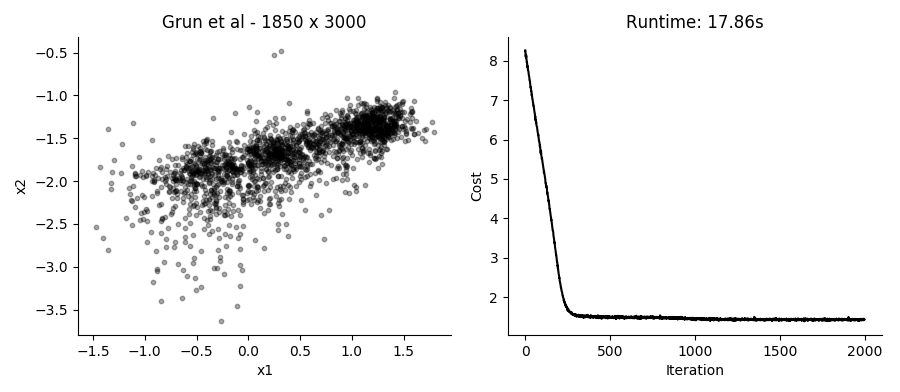


I like that in this model you can just provide UMI counts without any need to log transform or in other way Gaussianize the data. Though in practice, the results from performing regular PCA on log transformed counts give pretty similar results in a fraction of the time.
Different runs of the model also give slightly different results, though large scale patterns are pretty conserved between runs.
Here we are not enforcing any independence between the hidden factors, which should be a next step. Additionally, some way of selecting the number of factors like variance explained in PCA would be useful.
